The world's spaceports, 2025
Where the 329 orbital launches of 2025 lifted off, how launches changed since 1957, 2026 so far and what the FAA expects.
Preview This story is not published yet. Atlas checks every number against its source before it goes public. It was put together by hand for design and research; Atlas cannot yet make a story like this from a question.
- Orbital launch attempts, 2025329from 24 sites
- Busiest site, 202582Cape Canaveral
- 2026 so far245to 16 Oct 2026
Step 1: The picture
Where rockets launched in 2025
In 2025 there were 329 orbital launch attempts from 24 sites. Cape Canaveral had 82, Vandenberg 66 and Jiuquan 33.
11 of the 329 attempts failed to reach orbit or were partial failures, as GCAT records them.

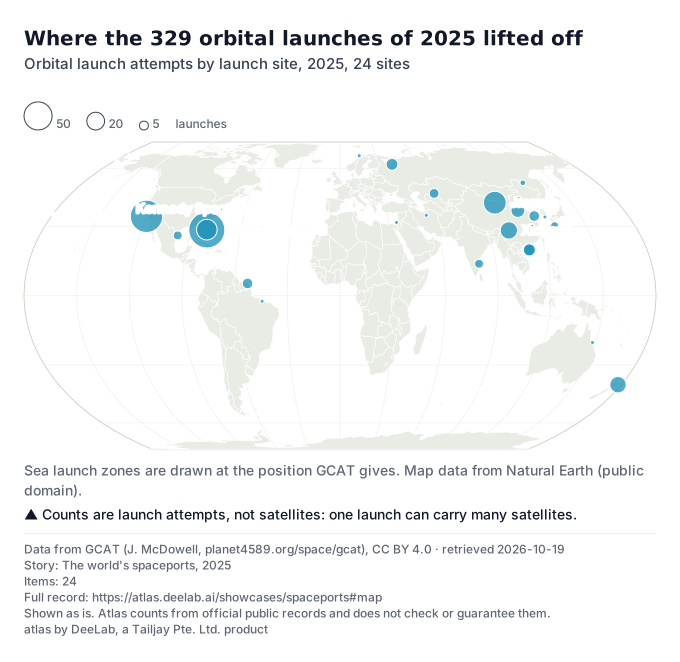
Show the table (24 rows)
| Site | 2025 (launches) | 2026 so far (launches) | Since 1957 (launches) |
|---|---|---|---|
| Cape Canaveral | 82 | 55 | 1,111 |
| Vandenberg | 66 | 67 | 893 |
| Jiuquan | 33 | 27 | 299 |
| Kennedy Space Center | 27 | 4 | 287 |
| Xichang | 19 | 6 | 242 |
| Mahia | 17 | 15 | 84 |
| Taiyuan | 12 | 12 | 161 |
| Wenchang | 12 | 6 | 51 |
| Hainan commercial launch site | 9 | 14 | 24 |
| Plesetsk | 9 | 8 | 1,686 |
| Kourou | 7 | 6 | 336 |
| Yellow Sea launch zone | 7 | 3 | 20 |
| Baikonur | 6 | 5 | 1,558 |
| Sriharikota | 5 | 3 | 103 |
| Starbase | 5 | 3 | 11 |
| Tanegashima | 4 | 2 | 99 |
| Vostochny | 2 | 0 | 21 |
| Alcantara | 1 | 0 | 3 |
| Andoya | 1 | 1 | 2 |
| Bowen | 1 | 0 | 1 |
| Naro | 1 | 1 | 8 |
| Palmachim | 1 | 0 | 13 |
| Semnan | 1 | 0 | 15 |
| Wallops | 1 | 1 | 59 |
About this data
- Where it comes from
- Licence
- Data from GCAT (J. McDowell, planet4589.org/space/gcat), CC BY 4.0 (CC BY 4.0)
- Data from GCAT (J. McDowell, planet4589.org/space/gcat), CC BY 4.0 (CC BY 4.0)
- Data from GCAT (J. McDowell, planet4589.org/space/gcat), CC BY 4.0 (CC BY 4.0)
- Borders and coastlines: Natural Earth, 1:110 million scale, version 5.1.2, downloaded on 2026-10-18. Made with Natural Earth (public domain). Projection: Equal Earth. Borders follow Natural Earth's default view and are not a statement by Atlas.
- Retrieved
- 19 Oct 2026, 02:57 UTC; the owner last changed the file on 17 Oct 2026
- 19 Oct 2026, 02:57 UTC; the owner last changed the file on 17 Oct 2026
- 19 Oct 2026, 02:57 UTC; the owner last changed the file on 17 Oct 2026
- What Atlas did
- Counted GCAT launches with code O (orbital) or D (deep space), failures included, pad explosions left out.
- Joined launch pads of one place under GCAT's short site name (for example Baikonur's two codes) and drew each site at GCAT's position, circle area by launches.
- Weak points
- Counts are launch attempts, not satellites: one launch can carry many satellites.
Shown as is. Atlas counts from official public records and does not check or guarantee them.
Step 2: How it changed
How launches changed since 1957
2025 had 329 orbital launch attempts, the most of any year since 1957 (1st of 69 years). 2024 had 262 and 2015 had 87.
Launch providers based in the United States made 181 of them (55%), China 92, Russia 17. The Soviet Union and Russia peaked at 108 in 1982.

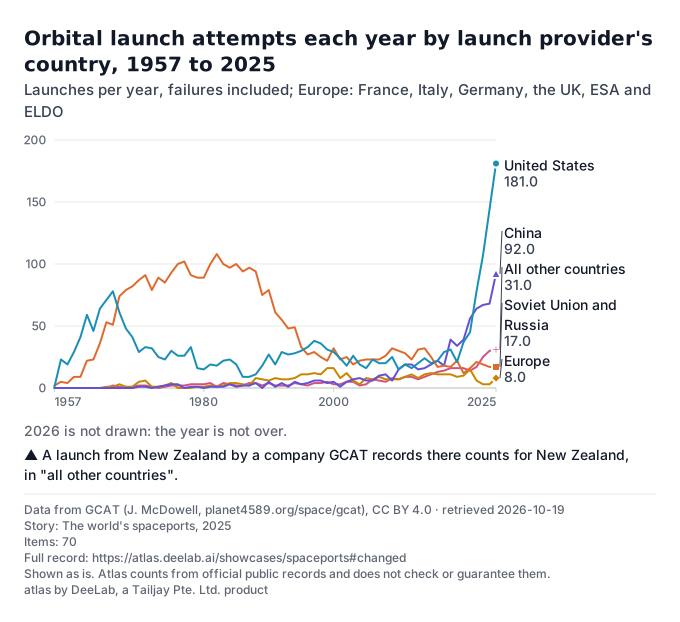
Show the table (70 rows)
| Year | United States (count) | Soviet Union and Russia (count) | China (count) | Europe (count) | All other countries (count) | Total (count) |
|---|---|---|---|---|---|---|
| 2026 | 131 | 13 | 72 | 7 | 22 | 245 |
| 2025 | 181 | 17 | 92 | 8 | 31 | 329 |
| 2024 | 144 | 17 | 68 | 3 | 30 | 262 |
| 2023 | 107 | 19 | 67 | 3 | 25 | 221 |
| 2022 | 78 | 21 | 64 | 6 | 17 | 186 |
| 2021 | 45 | 16 | 56 | 15 | 14 | 146 |
| 2020 | 37 | 12 | 39 | 10 | 16 | 114 |
| 2019 | 21 | 22 | 34 | 9 | 16 | 102 |
| 2018 | 31 | 17 | 39 | 11 | 16 | 114 |
| 2017 | 29 | 18 | 18 | 11 | 14 | 90 |
| 2016 | 22 | 17 | 22 | 11 | 13 | 85 |
| 2015 | 20 | 25 | 19 | 12 | 11 | 87 |
| 2014 | 24 | 32 | 16 | 11 | 9 | 92 |
| 2013 | 20 | 31 | 15 | 8 | 7 | 81 |
| 2012 | 16 | 23 | 19 | 11 | 9 | 78 |
| 2011 | 19 | 28 | 19 | 9 | 9 | 84 |
| 2010 | 15 | 30 | 15 | 7 | 7 | 74 |
| 2009 | 25 | 32 | 6 | 7 | 8 | 78 |
| 2008 | 20 | 26 | 11 | 7 | 5 | 69 |
| 2007 | 20 | 23 | 10 | 9 | 6 | 68 |
| 2006 | 23 | 23 | 6 | 7 | 7 | 66 |
| 2005 | 16 | 23 | 6 | 8 | 3 | 56 |
| 2004 | 19 | 22 | 8 | 3 | 2 | 54 |
| 2003 | 26 | 19 | 7 | 6 | 5 | 63 |
| 2002 | 18 | 25 | 5 | 12 | 5 | 65 |
| 2001 | 24 | 23 | 1 | 8 | 3 | 59 |
| 2000 | 29 | 32 | 5 | 16 | 3 | 85 |
| 1999 | 31 | 22 | 4 | 16 | 5 | 78 |
| 1998 | 36 | 25 | 6 | 11 | 4 | 82 |
| 1997 | 38 | 29 | 6 | 12 | 4 | 89 |
| 1996 | 33 | 27 | 4 | 11 | 2 | 77 |
| 1995 | 30 | 33 | 3 | 11 | 3 | 80 |
| 1994 | 28 | 49 | 5 | 8 | 4 | 94 |
| 1993 | 27 | 48 | 1 | 7 | 2 | 85 |
| 1992 | 29 | 55 | 4 | 7 | 2 | 97 |
| 1991 | 19 | 61 | 1 | 8 | 2 | 91 |
| 1990 | 27 | 79 | 5 | 6 | 4 | 121 |
| 1989 | 18 | 75 | 0 | 7 | 2 | 102 |
| 1988 | 11 | 94 | 4 | 8 | 4 | 121 |
| 1987 | 9 | 97 | 2 | 2 | 4 | 114 |
| 1986 | 9 | 94 | 2 | 3 | 2 | 110 |
| 1985 | 19 | 100 | 1 | 4 | 2 | 126 |
| 1984 | 23 | 97 | 3 | 4 | 3 | 130 |
| 1983 | 22 | 100 | 1 | 2 | 4 | 129 |
| 1982 | 18 | 108 | 1 | 1 | 1 | 129 |
| 1981 | 19 | 100 | 1 | 2 | 4 | 126 |
| 1980 | 15 | 89 | 0 | 1 | 3 | 108 |
| 1979 | 16 | 89 | 1 | 1 | 3 | 110 |
| 1978 | 33 | 91 | 1 | 0 | 3 | 128 |
| 1977 | 26 | 102 | 0 | 0 | 2 | 130 |
| 1976 | 26 | 100 | 3 | 0 | 2 | 131 |
| 1975 | 30 | 93 | 3 | 4 | 2 | 132 |
| 1974 | 23 | 85 | 2 | 2 | 1 | 113 |
| 1973 | 25 | 89 | 1 | 1 | 0 | 116 |
| 1972 | 32 | 79 | 0 | 1 | 1 | 113 |
| 1971 | 33 | 91 | 1 | 6 | 2 | 133 |
| 1970 | 29 | 87 | 1 | 5 | 2 | 124 |
| 1969 | 41 | 82 | 0 | 1 | 1 | 125 |
| 1968 | 48 | 79 | 0 | 1 | 0 | 128 |
| 1967 | 61 | 74 | 0 | 3 | 1 | 139 |
| 1966 | 78 | 51 | 0 | 1 | 2 | 132 |
| 1965 | 71 | 53 | 0 | 1 | 0 | 125 |
| 1964 | 64 | 36 | 0 | 0 | 0 | 100 |
| 1963 | 46 | 23 | 0 | 0 | 0 | 69 |
| 1962 | 59 | 22 | 0 | 0 | 0 | 81 |
| 1961 | 41 | 9 | 0 | 0 | 0 | 50 |
| 1960 | 29 | 9 | 0 | 0 | 0 | 38 |
| 1959 | 19 | 4 | 0 | 0 | 0 | 23 |
| 1958 | 23 | 5 | 0 | 0 | 0 | 28 |
| 1957 | 1 | 2 | 0 | 0 | 0 | 3 |
About this data
- Where it comes from
- Licence
- Data from GCAT (J. McDowell, planet4589.org/space/gcat), CC BY 4.0 (CC BY 4.0)
- Data from GCAT (J. McDowell, planet4589.org/space/gcat), CC BY 4.0 (CC BY 4.0)
- Retrieved
- 19 Oct 2026, 02:57 UTC; the owner last changed the file on 17 Oct 2026
- 19 Oct 2026, 02:57 UTC; the owner last changed the file on 17 Oct 2026
- What Atlas did
- Gave each launch the country of its launch provider (GCAT agency to its state), then grouped: United States; Soviet Union and Russia; China; Europe; all other countries.
- Weak points
- A launch from New Zealand by a company GCAT records there counts for New Zealand, in "all other countries".
Shown as is. Atlas counts from official public records and does not check or guarantee them.
Step 3: Where it is now
Launches by site in 2025
The three busiest sites made 181 of the 329 launches.

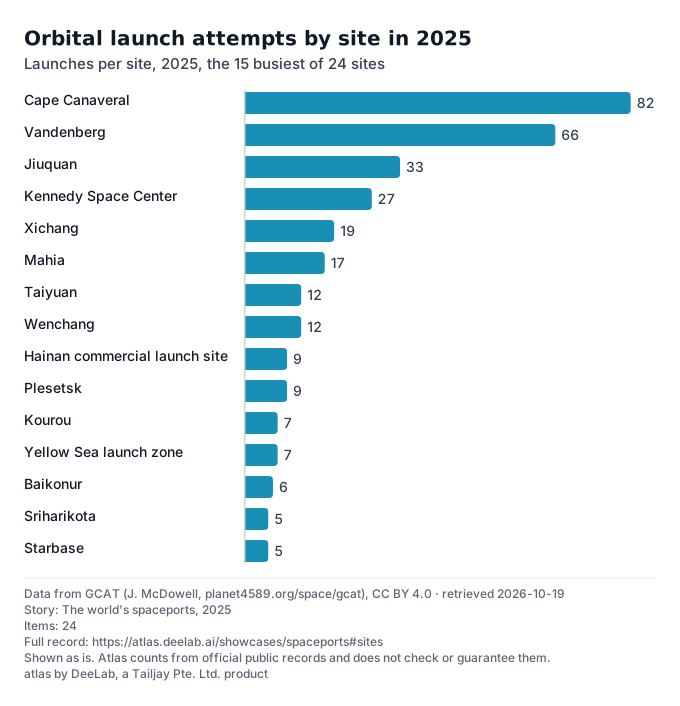
Show the table (24 rows)
| Site | 2025 (launches) |
|---|---|
| Cape Canaveral | 82 |
| Vandenberg | 66 |
| Jiuquan | 33 |
| Kennedy Space Center | 27 |
| Xichang | 19 |
| Mahia | 17 |
| Taiyuan | 12 |
| Wenchang | 12 |
| Hainan commercial launch site | 9 |
| Plesetsk | 9 |
| Kourou | 7 |
| Yellow Sea launch zone | 7 |
| Baikonur | 6 |
| Sriharikota | 5 |
| Starbase | 5 |
| Tanegashima | 4 |
| Vostochny | 2 |
| Alcantara | 1 |
| Andoya | 1 |
| Bowen | 1 |
| Naro | 1 |
| Palmachim | 1 |
| Semnan | 1 |
| Wallops | 1 |
About this data
- Where it comes from
- Licence
- Data from GCAT (J. McDowell, planet4589.org/space/gcat), CC BY 4.0 (CC BY 4.0)
- Data from GCAT (J. McDowell, planet4589.org/space/gcat), CC BY 4.0 (CC BY 4.0)
- Retrieved
- 19 Oct 2026, 02:57 UTC; the owner last changed the file on 17 Oct 2026
- 19 Oct 2026, 02:57 UTC; the owner last changed the file on 17 Oct 2026
- What Atlas did
- Ranked launch sites by orbital launch attempts in 2025.
- Weak points
- No weak points flagged for this chart.
Shown as is. Atlas counts from official public records and does not check or guarantee them.
Step 4: Where it is now
2026 so far
From 1 January to 16 Oct 2026, there were 245 orbital launch attempts in 2026, against 329 in all of 2025.
By the same date in 2025 there had been 243.
GCAT was last updated on 17 Oct 2026.

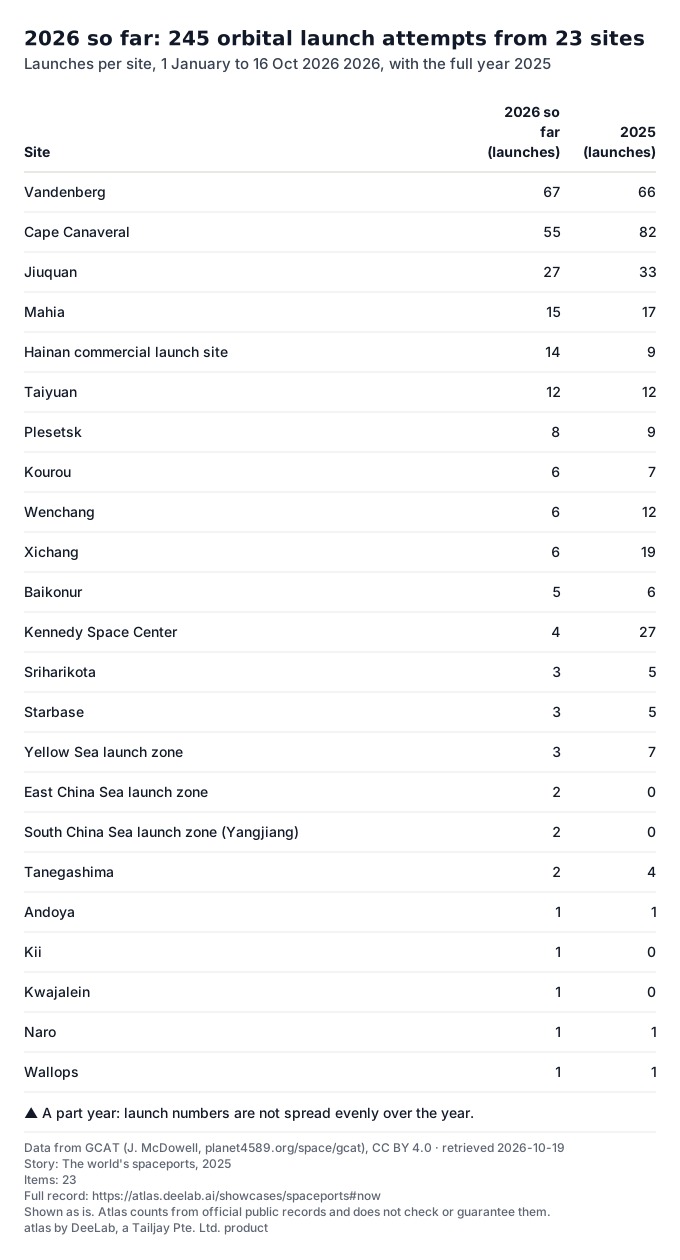
Show the table (23 rows)
| Site | 2026 so far (launches) | 2025 (launches) |
|---|---|---|
| Vandenberg | 67 | 66 |
| Cape Canaveral | 55 | 82 |
| Jiuquan | 27 | 33 |
| Mahia | 15 | 17 |
| Hainan commercial launch site | 14 | 9 |
| Taiyuan | 12 | 12 |
| Plesetsk | 8 | 9 |
| Kourou | 6 | 7 |
| Wenchang | 6 | 12 |
| Xichang | 6 | 19 |
| Baikonur | 5 | 6 |
| Kennedy Space Center | 4 | 27 |
| Sriharikota | 3 | 5 |
| Starbase | 3 | 5 |
| Yellow Sea launch zone | 3 | 7 |
| East China Sea launch zone | 2 | 0 |
| South China Sea launch zone (Yangjiang) | 2 | 0 |
| Tanegashima | 2 | 4 |
| Andoya | 1 | 1 |
| Kii | 1 | 0 |
| Kwajalein | 1 | 0 |
| Naro | 1 | 1 |
| Wallops | 1 | 1 |
About this data
- Where it comes from
- Licence
- Data from GCAT (J. McDowell, planet4589.org/space/gcat), CC BY 4.0 (CC BY 4.0)
- Data from GCAT (J. McDowell, planet4589.org/space/gcat), CC BY 4.0 (CC BY 4.0)
- Retrieved
- 19 Oct 2026, 02:57 UTC; the owner last changed the file on 17 Oct 2026
- 19 Oct 2026, 02:57 UTC; the owner last changed the file on 17 Oct 2026
- What Atlas did
- Counted the same way as 2025, from 1 January 2026 to the latest launch in GCAT.
- Weak points
- A part year: launch numbers are not spread evenly over the year.
Shown as is. Atlas counts from official public records and does not check or guarantee them.
Step 5: What is expected
What is expected
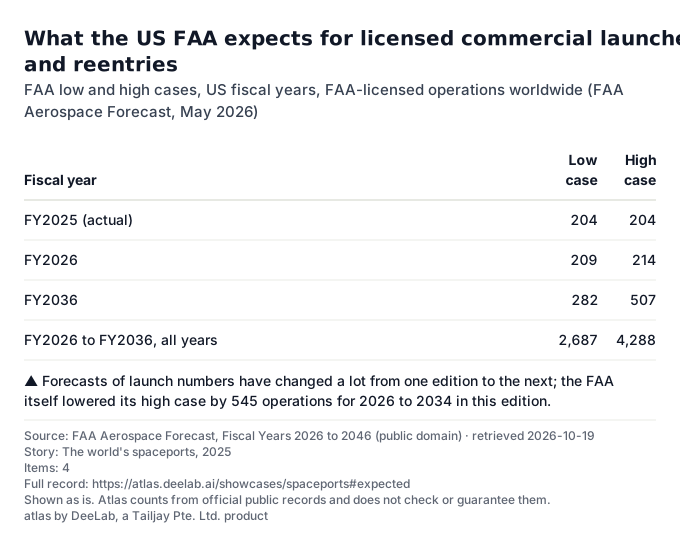
The only open official projection Atlas found is the US Federal Aviation Administration's. In its Aerospace Forecast of May 2026, the FAA expects 209 to 214 FAA-licensed commercial launches and reentries in fiscal year 2026, and 282 to 507 in 2036 (low and high cases).
This counts something different from the rest of this page: US-licensed commercial operations only, reentries included, by US fiscal year (October to September). It is the FAA's projection, not an Atlas forecast.

Show the table (4 rows)
| Fiscal year | Low case | High case |
|---|---|---|
| FY2025 (actual) | 204 | 204 |
| FY2026 | 209 | 214 |
| FY2036 | 282 | 507 |
| FY2026 to FY2036, all years | 2,687 | 4,288 |
About this data
- Where it comes from
- US Federal Aviation Administration, Office of Commercial Space Transportation: FAA Aerospace Forecast, Fiscal Years 2026 to 2046, commercial space chapter · source
- Licence
- Source: FAA Aerospace Forecast, Fiscal Years 2026 to 2046 (public domain) (US government work, public domain)
- Retrieved
- 19 Oct 2026, 00:00 UTC. Read by hand from the PDF on 2026-10-19; the automated fetch was refused.
- What Atlas did
- Copied the FAA's low and high cases from the commercial space chapter of the FAA Aerospace Forecast, Fiscal Years 2026 to 2046.
- Weak points
- Forecasts of launch numbers have changed a lot from one edition to the next; the FAA itself lowered its high case by 545 operations for 2026 to 2034 in this edition.
Shown as is. Atlas counts from official public records and does not check or guarantee them.
Sources
- GCAT launch list (J. McDowell) · CC BY 4.0 · retrieved 2026-10-19
- GCAT launch sites table (J. McDowell) · CC BY 4.0 · retrieved 2026-10-19
- GCAT organisations table (J. McDowell) · CC BY 4.0 · retrieved 2026-10-19
- FAA Aerospace Forecast, Fiscal Years 2026 to 2046, commercial space chapter · US government work, public domain · retrieved 2026-10-19
- Borders and coastlines: Natural Earth, 1:110 million scale, version 5.1.2, downloaded on 2026-10-18. Made with Natural Earth (public domain). Projection: Equal Earth. Borders follow Natural Earth's default view and are not a statement by Atlas.
Data to 16 Oct 2026. Atlas made no forecasts on this page; outlooks and long-run rates are the owners' own, with their dates.
atlas by DeeLab, a Tailjay Pte. Ltd. product