Every Atlantic hurricane since 1980
Where 317 hurricanes went, how the yearly count changed, where 2026 stands and what NOAA expected for this season.
Preview This story is not published yet. Atlas checks every number against its source before it goes public. It was put together by hand for design and research; Atlas cannot yet make a story like this from a question.
- Hurricanes since 1980317to 11 Oct 2026
- Normal season (1991 to 2020)14.4named storms a season
- 2026 so far9named storms, 1 hurricane
Step 1: The picture
Where they went
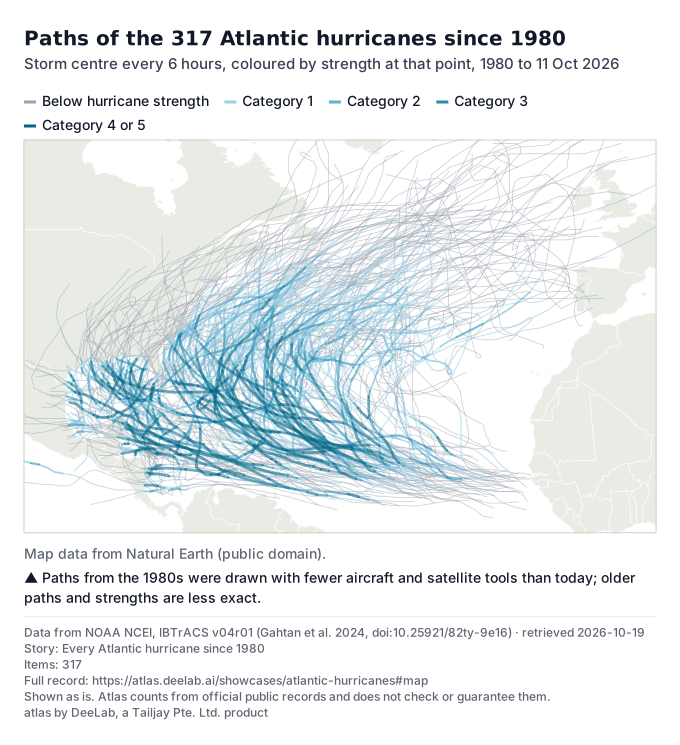
317 storms reached hurricane strength in the North Atlantic from 1980 to 11 Oct 2026. 135 of them reached category 3 or more at some point (a major hurricane).
Each path is coloured by the storm's strength at that point, so one storm can change colour along the way. Darker lines are stronger.

Show the table (317 rows)
| Season | Storm | Strongest |
|---|---|---|
| 2026 | Isaias | Category 3 |
| 2025 | Erin | Category 5 |
| 2025 | Gabrielle | Category 4 |
| 2025 | Humberto | Category 5 |
| 2025 | Imelda | Category 1 |
| 2025 | Melissa | Category 5 |
| 2024 | Beryl | Category 5 |
| 2024 | Debby | Category 1 |
| 2024 | Ernesto | Category 2 |
| 2024 | Francine | Category 2 |
| 2024 | Helene | Category 4 |
| 2024 | Isaac | Category 2 |
| 2024 | Kirk | Category 4 |
| 2024 | Leslie | Category 2 |
| 2024 | Milton | Category 5 |
| 2024 | Oscar | Category 1 |
| 2024 | Rafael | Category 3 |
| 2023 | Don | Category 1 |
| 2023 | Franklin | Category 4 |
| 2023 | Idalia | Category 4 |
| 2023 | Lee | Category 5 |
| 2023 | Margot | Category 1 |
| 2023 | Nigel | Category 2 |
| 2023 | Tammy | Category 2 |
| 2022 | Bonnie | Category 3 |
| 2022 | Danielle | Category 1 |
| 2022 | Earl | Category 2 |
| 2022 | Fiona | Category 4 |
| 2022 | Ian | Category 5 |
| 2022 | Julia | Category 1 |
| 2022 | Lisa | Category 1 |
| 2022 | Martin | Category 1 |
| 2022 | Nicole | Category 1 |
| 2021 | Elsa | Category 1 |
| 2021 | Grace | Category 3 |
| 2021 | Henri | Category 1 |
| 2021 | Ida | Category 4 |
| 2021 | Larry | Category 3 |
| 2021 | Nicholas | Category 1 |
| 2021 | Sam | Category 4 |
| 2020 | Delta | Category 4 |
| 2020 | Epsilon | Category 3 |
| 2020 | Eta | Category 4 |
| 2020 | Gamma | Category 1 |
| 2020 | Hanna | Category 1 |
| 2020 | Iota | Category 4 |
| 2020 | Isaias | Category 1 |
| 2020 | Laura | Category 4 |
| 2020 | Marco | Category 1 |
| 2020 | Nana | Category 1 |
| 2020 | Paulette | Category 2 |
| 2020 | Sally | Category 2 |
| 2020 | Teddy | Category 4 |
| 2020 | Zeta | Category 3 |
| 2019 | Barry | Category 1 |
| 2019 | Dorian | Category 5 |
| 2019 | Humberto | Category 3 |
| 2019 | Jerry | Category 2 |
| 2019 | Lorenzo | Category 5 |
| 2019 | Pablo | Category 1 |
| 2018 | Beryl | Category 1 |
| 2018 | Chris | Category 2 |
| 2018 | Florence | Category 4 |
| 2018 | Helene | Category 2 |
| 2018 | Isaac | Category 1 |
| 2018 | Leslie | Category 1 |
| 2018 | Michael | Category 5 |
| 2018 | Oscar | Category 2 |
| 2017 | Franklin | Category 1 |
| 2017 | Gert | Category 2 |
| 2017 | Harvey | Category 4 |
| 2017 | Irma | Category 5 |
| 2017 | Jose | Category 4 |
| 2017 | Katia | Category 2 |
| 2017 | Lee | Category 3 |
| 2017 | Maria | Category 5 |
| 2017 | Nate | Category 1 |
| 2017 | Ophelia | Category 3 |
| 2016 | Alex | Category 1 |
| 2016 | Earl | Category 1 |
| 2016 | Gaston | Category 3 |
| 2016 | Hermine | Category 1 |
| 2016 | Matthew | Category 5 |
| 2016 | Nicole | Category 4 |
| 2016 | Otto | Category 3 |
| 2015 | Danny | Category 3 |
| 2015 | Fred | Category 1 |
| 2015 | Joaquin | Category 4 |
| 2015 | Kate | Category 1 |
| 2014 | Arthur | Category 2 |
| 2014 | Bertha | Category 1 |
| 2014 | Cristobal | Category 1 |
| 2014 | Edouard | Category 3 |
| 2014 | Fay | Category 1 |
| 2014 | Gonzalo | Category 4 |
| 2013 | Barbara | Category 1 |
| 2013 | Humberto | Category 1 |
| 2013 | Ingrid | Category 1 |
| 2012 | Chris | Category 1 |
| 2012 | Ernesto | Category 2 |
| 2012 | Gordon | Category 2 |
| 2012 | Isaac | Category 1 |
| 2012 | Kirk | Category 2 |
| 2012 | Leslie | Category 1 |
| 2012 | Michael | Category 3 |
| 2012 | Nadine | Category 1 |
| 2012 | Rafael | Category 1 |
| 2012 | Sandy | Category 3 |
| 2011 | Irene | Category 3 |
| 2011 | Katia | Category 4 |
| 2011 | Maria | Category 1 |
| 2011 | Nate | Category 1 |
| 2011 | Ophelia | Category 4 |
| 2011 | Philippe | Category 1 |
| 2011 | Rina | Category 3 |
| 2010 | Alex | Category 2 |
| 2010 | Danielle | Category 4 |
| 2010 | Earl | Category 4 |
| 2010 | Igor | Category 4 |
| 2010 | Julia | Category 4 |
| 2010 | Karl | Category 3 |
| 2010 | Lisa | Category 1 |
| 2010 | Otto | Category 1 |
| 2010 | Paula | Category 2 |
| 2010 | Richard | Category 2 |
| 2010 | Shary | Category 1 |
| 2010 | Tomas | Category 2 |
| 2009 | Bill | Category 4 |
| 2009 | Fred | Category 3 |
| 2009 | Ida | Category 2 |
| 2008 | Bertha | Category 3 |
| 2008 | Dolly | Category 2 |
| 2008 | Gustav | Category 4 |
| 2008 | Hanna | Category 1 |
| 2008 | Ike | Category 4 |
| 2008 | Kyle | Category 1 |
| 2008 | Omar | Category 4 |
| 2008 | Paloma | Category 4 |
| 2007 | Dean | Category 5 |
| 2007 | Felix | Category 5 |
| 2007 | Humberto | Category 1 |
| 2007 | Karen | Category 1 |
| 2007 | Lorenzo | Category 1 |
| 2007 | Noel | Category 1 |
| 2006 | Ernesto | Category 1 |
| 2006 | Florence | Category 1 |
| 2006 | Gordon | Category 3 |
| 2006 | Helene | Category 3 |
| 2006 | Isaac | Category 1 |
| 2005 | Beta | Category 3 |
| 2005 | Cindy | Category 1 |
| 2005 | Dennis | Category 4 |
| 2005 | Emily | Category 5 |
| 2005 | Epsilon | Category 1 |
| 2005 | Irene | Category 2 |
| 2005 | Katrina | Category 5 |
| 2005 | Maria | Category 3 |
| 2005 | Nate | Category 1 |
| 2005 | Ophelia | Category 1 |
| 2005 | Philippe | Category 1 |
| 2005 | Rita | Category 5 |
| 2005 | Stan | Category 1 |
| 2005 | Vince | Category 1 |
| 2005 | Wilma | Category 5 |
| 2004 | Alex | Category 3 |
| 2004 | Charley | Category 4 |
| 2004 | Danielle | Category 2 |
| 2004 | Frances | Category 4 |
| 2004 | Gaston | Category 1 |
| 2004 | Ivan | Category 5 |
| 2004 | Jeanne | Category 3 |
| 2004 | Karl | Category 4 |
| 2004 | Lisa | Category 1 |
| 2003 | Claudette | Category 1 |
| 2003 | Danny | Category 1 |
| 2003 | Erika | Category 1 |
| 2003 | Fabian | Category 4 |
| 2003 | Isabel | Category 5 |
| 2003 | Juan | Category 2 |
| 2003 | Kate | Category 3 |
| 2002 | Gustav | Category 2 |
| 2002 | Isidore | Category 3 |
| 2002 | Kyle | Category 1 |
| 2002 | Lili | Category 4 |
| 2001 | Erin | Category 3 |
| 2001 | Felix | Category 3 |
| 2001 | Gabrielle | Category 1 |
| 2001 | Humberto | Category 2 |
| 2001 | Iris | Category 4 |
| 2001 | Karen | Category 1 |
| 2001 | Michelle | Category 4 |
| 2001 | Noel | Category 1 |
| 2001 | Olga | Category 1 |
| 2000 | Alberto | Category 3 |
| 2000 | Debby | Category 1 |
| 2000 | Florence | Category 1 |
| 2000 | Gordon | Category 1 |
| 2000 | Isaac | Category 4 |
| 2000 | Joyce | Category 1 |
| 2000 | Keith | Category 4 |
| 2000 | Michael | Category 2 |
| 1999 | Bret | Category 4 |
| 1999 | Cindy | Category 4 |
| 1999 | Dennis | Category 2 |
| 1999 | Floyd | Category 4 |
| 1999 | Gert | Category 4 |
| 1999 | Irene | Category 2 |
| 1999 | Jose | Category 2 |
| 1999 | Lenny | Category 4 |
| 1998 | Bonnie | Category 3 |
| 1998 | Danielle | Category 2 |
| 1998 | Earl | Category 2 |
| 1998 | Georges | Category 4 |
| 1998 | Ivan | Category 1 |
| 1998 | Jeanne | Category 2 |
| 1998 | Karl | Category 2 |
| 1998 | Lisa | Category 1 |
| 1998 | Mitch | Category 5 |
| 1998 | Nicole | Category 1 |
| 1997 | Bill | Category 1 |
| 1997 | Danny | Category 1 |
| 1997 | Erika | Category 3 |
| 1996 | Bertha | Category 3 |
| 1996 | Cesar | Category 1 |
| 1996 | Dolly | Category 1 |
| 1996 | Edouard | Category 4 |
| 1996 | Fran | Category 3 |
| 1996 | Hortense | Category 4 |
| 1996 | Isidore | Category 3 |
| 1996 | Lili | Category 3 |
| 1996 | Marco | Category 1 |
| 1995 | Allison | Category 1 |
| 1995 | Erin | Category 2 |
| 1995 | Felix | Category 4 |
| 1995 | Humberto | Category 2 |
| 1995 | Iris | Category 2 |
| 1995 | Luis | Category 4 |
| 1995 | Marilyn | Category 3 |
| 1995 | Noel | Category 1 |
| 1995 | Opal | Category 4 |
| 1995 | Roxanne | Category 3 |
| 1995 | Tanya | Category 1 |
| 1994 | Chris | Category 1 |
| 1994 | Florence | Category 2 |
| 1994 | Gordon | Category 1 |
| 1993 | Emily | Category 3 |
| 1993 | Floyd | Category 1 |
| 1993 | Gert | Category 2 |
| 1993 | Harvey | Category 1 |
| 1992 | Andrew | Category 5 |
| 1992 | Bonnie | Category 2 |
| 1992 | Charley | Category 2 |
| 1992 | Frances | Category 1 |
| 1991 | Bob | Category 3 |
| 1991 | Claudette | Category 4 |
| 1991 | Grace | Category 2 |
| 1991 | Unnamed | Category 1 |
| 1990 | Bertha | Category 1 |
| 1990 | Diana | Category 2 |
| 1990 | Gustav | Category 3 |
| 1990 | Isidore | Category 2 |
| 1990 | Josephine | Category 1 |
| 1990 | Klaus | Category 1 |
| 1990 | Lili | Category 1 |
| 1990 | Nana | Category 1 |
| 1989 | Chantal | Category 1 |
| 1989 | Dean | Category 2 |
| 1989 | Erin | Category 2 |
| 1989 | Felix | Category 1 |
| 1989 | Gabrielle | Category 4 |
| 1989 | Hugo | Category 5 |
| 1989 | Jerry | Category 1 |
| 1988 | Debby | Category 1 |
| 1988 | Florence | Category 1 |
| 1988 | Gilbert | Category 5 |
| 1988 | Helene | Category 4 |
| 1988 | Joan:miriam | Category 4 |
| 1987 | Arlene | Category 1 |
| 1987 | Emily | Category 3 |
| 1987 | Floyd | Category 1 |
| 1986 | Bonnie | Category 1 |
| 1986 | Charley | Category 1 |
| 1986 | Earl | Category 2 |
| 1986 | Frances | Category 1 |
| 1985 | Bob | Category 1 |
| 1985 | Claudette | Category 1 |
| 1985 | Danny | Category 1 |
| 1985 | Elena | Category 3 |
| 1985 | Gloria | Category 4 |
| 1985 | Juan | Category 1 |
| 1985 | Kate | Category 3 |
| 1984 | Diana | Category 4 |
| 1984 | Hortense | Category 1 |
| 1984 | Josephine | Category 2 |
| 1984 | Klaus | Category 1 |
| 1984 | Lili | Category 1 |
| 1983 | Alicia | Category 3 |
| 1983 | Barry | Category 1 |
| 1983 | Chantal | Category 1 |
| 1982 | Alberto | Category 1 |
| 1982 | Debby | Category 4 |
| 1981 | Dennis | Category 1 |
| 1981 | Emily | Category 1 |
| 1981 | Floyd | Category 3 |
| 1981 | Gert | Category 2 |
| 1981 | Harvey | Category 4 |
| 1981 | Irene | Category 3 |
| 1981 | Katrina | Category 1 |
| 1980 | Allen | Category 5 |
| 1980 | Bonnie | Category 2 |
| 1980 | Charley | Category 1 |
| 1980 | Earl | Category 1 |
| 1980 | Frances | Category 3 |
| 1980 | Georges | Category 1 |
| 1980 | Ivan | Category 2 |
| 1980 | Jeanne | Category 2 |
| 1980 | Karl | Category 1 |
About this data
- Where it comes from
- NOAA National Centers for Environmental Information: NOAA NCEI, IBTrACS v04r01, North Atlantic · source
- Licence
- Data from NOAA NCEI, IBTrACS v04r01 (Gahtan et al. 2024, doi:10.25921/82ty-9e16) (US government work, public domain; cite as asked)
- Borders and coastlines: Natural Earth, 1:110 million scale, version 5.1.2, downloaded on 2026-10-18. Made with Natural Earth (public domain). Projection: Equal Earth. Borders follow Natural Earth's default view and are not a statement by Atlas.
- Retrieved
- 19 Oct 2026, 02:35 UTC; the owner last changed the file on 18 Oct 2026
- What Atlas did
- Kept every system in IBTrACS for the North Atlantic since 1980 that reached hurricane strength in the US agencies' (NHC) best track.
- Drew the storm centre every 6 hours (00, 06, 12 and 18 UTC) and coloured each stretch by the Saffir-Simpson category at its start.
- Categories 4 and 5 share one colour so the map keeps five colours at most.
- Weak points
- Paths from the 1980s were drawn with fewer aircraft and satellite tools than today; older paths and strengths are less exact.
Shown as is. Atlas counts from official public records and does not check or guarantee them.
Step 2: How it changed
How the yearly count changed
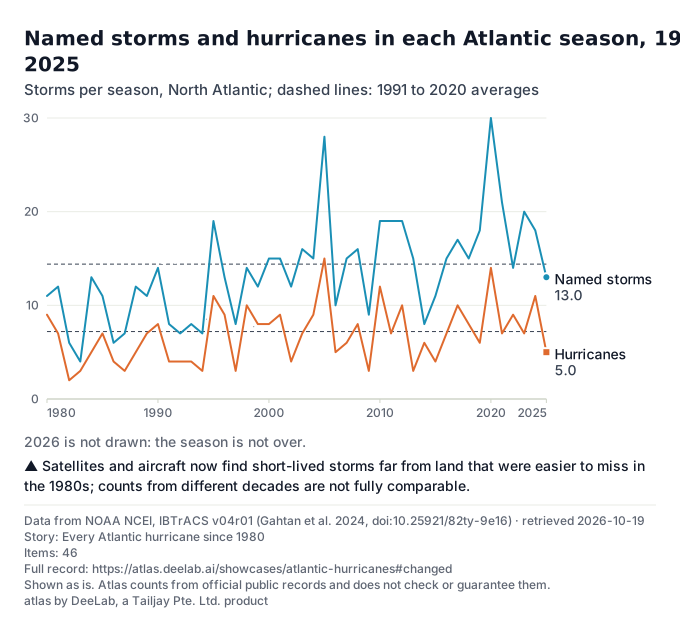
In 1991 to 2020, the period NOAA uses as normal, an Atlantic season had on average 14.4 named storms, 7.2 hurricanes and 3.2 major hurricanes. Atlas counted these from IBTrACS and gets NOAA's own figures.
The busiest season since 1980 was 2020 with 30 named storms (1st of 46 seasons), then 2005 with 28. The quietest was 1983 with 4 (46th of 46).
In the first 23 seasons (1980 to 2002), 3 had more named storms than the 1991 to 2020 average. In the last 23 (2003 to 2025), 17 did.

Show the table (46 rows)
| Season | Named storms (count) | Hurricanes (count) | Major hurricanes (count) |
|---|---|---|---|
| 2025 | 13 | 5 | 4 |
| 2024 | 18 | 11 | 5 |
| 2023 | 20 | 7 | 3 |
| 2022 | 14 | 9 | 3 |
| 2021 | 21 | 7 | 4 |
| 2020 | 30 | 14 | 7 |
| 2019 | 18 | 6 | 3 |
| 2018 | 15 | 8 | 2 |
| 2017 | 17 | 10 | 6 |
| 2016 | 15 | 7 | 4 |
| 2015 | 11 | 4 | 2 |
| 2014 | 8 | 6 | 2 |
| 2013 | 15 | 3 | 0 |
| 2012 | 19 | 10 | 2 |
| 2011 | 19 | 7 | 4 |
| 2010 | 19 | 12 | 5 |
| 2009 | 9 | 3 | 2 |
| 2008 | 16 | 8 | 5 |
| 2007 | 15 | 6 | 2 |
| 2006 | 10 | 5 | 2 |
| 2005 | 28 | 15 | 7 |
| 2004 | 15 | 9 | 6 |
| 2003 | 16 | 7 | 3 |
| 2002 | 12 | 4 | 2 |
| 2001 | 15 | 9 | 4 |
| 2000 | 15 | 8 | 3 |
| 1999 | 12 | 8 | 5 |
| 1998 | 14 | 10 | 3 |
| 1997 | 8 | 3 | 1 |
| 1996 | 13 | 9 | 6 |
| 1995 | 19 | 11 | 5 |
| 1994 | 7 | 3 | 0 |
| 1993 | 8 | 4 | 1 |
| 1992 | 7 | 4 | 1 |
| 1991 | 8 | 4 | 2 |
| 1990 | 14 | 8 | 1 |
| 1989 | 11 | 7 | 2 |
| 1988 | 12 | 5 | 3 |
| 1987 | 7 | 3 | 1 |
| 1986 | 6 | 4 | 0 |
| 1985 | 11 | 7 | 3 |
| 1984 | 13 | 5 | 1 |
| 1983 | 4 | 3 | 1 |
| 1982 | 6 | 2 | 1 |
| 1981 | 12 | 7 | 3 |
| 1980 | 11 | 9 | 2 |
About this data
- Where it comes from
- NOAA National Centers for Environmental Information: NOAA NCEI, IBTrACS v04r01, North Atlantic · source
- Licence
- Data from NOAA NCEI, IBTrACS v04r01 (Gahtan et al. 2024, doi:10.25921/82ty-9e16) (US government work, public domain; cite as asked)
- Retrieved
- 19 Oct 2026, 02:35 UTC; the owner last changed the file on 18 Oct 2026
- What Atlas did
- Counted named storms (34 knots or more as a tropical or subtropical storm), hurricanes (64 knots or more) and major hurricanes (96 knots or more, category 3 and up) per season, NOAA's rules.
- Averaged 1991 to 2020, NOAA's normal period.
- Weak points
- Satellites and aircraft now find short-lived storms far from land that were easier to miss in the 1980s; counts from different decades are not fully comparable.
Shown as is. Atlas counts from official public records and does not check or guarantee them.
Step 3: How it changed
Major hurricanes, decade by decade
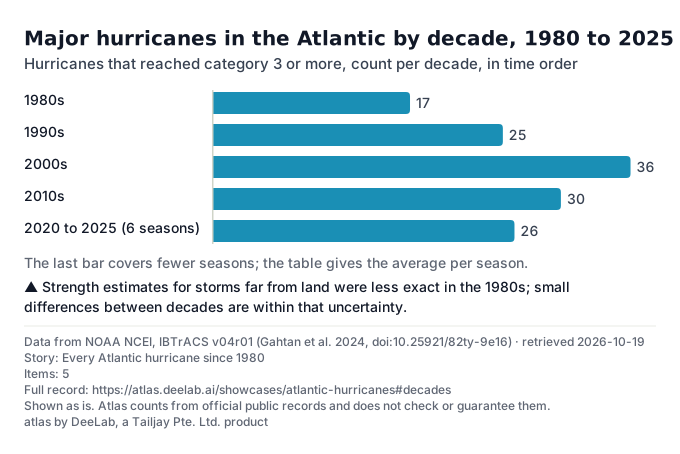
1980s: 17 major hurricanes, 1.7 a season.
1990s: 25 major hurricanes, 2.5 a season.
2000s: 36 major hurricanes, 3.6 a season.
2010s: 30 major hurricanes, 3.0 a season.
2020 to 2025 (6 seasons): 26 major hurricanes, 4.3 a season.

Show the table (5 rows)
| Decade | Major hurricanes (count) | Per season (average) |
|---|---|---|
| 1980s | 17 | 1.7 |
| 1990s | 25 | 2.5 |
| 2000s | 36 | 3.6 |
| 2010s | 30 | 3.0 |
| 2020 to 2025 (6 seasons) | 26 | 4.3 |
About this data
- Where it comes from
- NOAA National Centers for Environmental Information: NOAA NCEI, IBTrACS v04r01, North Atlantic · source
- Licence
- Data from NOAA NCEI, IBTrACS v04r01 (Gahtan et al. 2024, doi:10.25921/82ty-9e16) (US government work, public domain; cite as asked)
- Retrieved
- 19 Oct 2026, 02:35 UTC; the owner last changed the file on 18 Oct 2026
- What Atlas did
- Counted hurricanes that reached category 3 or more (96 knots or more) at any point, per season, then added the seasons of each decade.
- Weak points
- Strength estimates for storms far from land were less exact in the 1980s; small differences between decades are within that uncertainty.
Shown as is. Atlas counts from official public records and does not check or guarantee them.
Step 4: Where it is now
The 2026 season so far
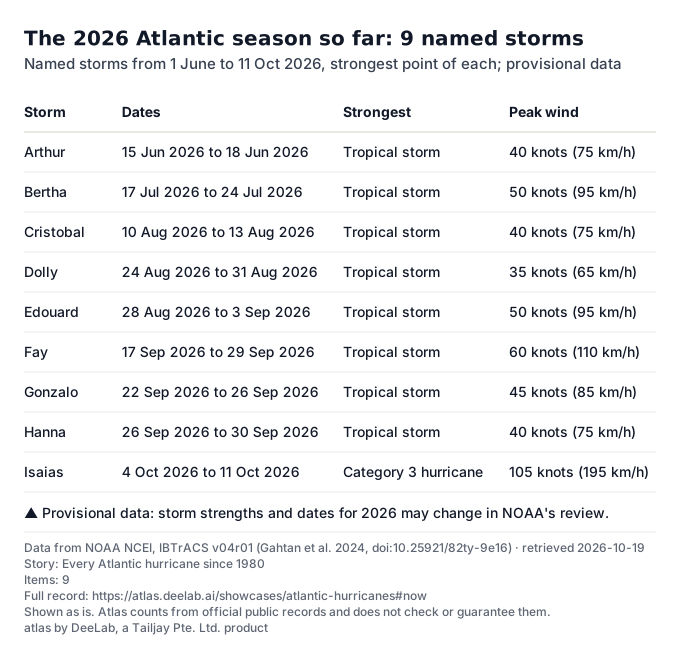
To 11 Oct 2026, the 2026 season had 9 named storms, 1 hurricane and 1 major hurricane. The season runs from 1 June to 30 November.
These records are provisional: NOAA reviews each season after it ends, and numbers can change.

Show the table (9 rows)
| Storm | Dates | Strongest | Peak wind |
|---|---|---|---|
| Arthur | 15 Jun 2026 to 18 Jun 2026 | Tropical storm | 40 knots (75 km/h) |
| Bertha | 17 Jul 2026 to 24 Jul 2026 | Tropical storm | 50 knots (95 km/h) |
| Cristobal | 10 Aug 2026 to 13 Aug 2026 | Tropical storm | 40 knots (75 km/h) |
| Dolly | 24 Aug 2026 to 31 Aug 2026 | Tropical storm | 35 knots (65 km/h) |
| Edouard | 28 Aug 2026 to 3 Sep 2026 | Tropical storm | 50 knots (95 km/h) |
| Fay | 17 Sep 2026 to 29 Sep 2026 | Tropical storm | 60 knots (110 km/h) |
| Gonzalo | 22 Sep 2026 to 26 Sep 2026 | Tropical storm | 45 knots (85 km/h) |
| Hanna | 26 Sep 2026 to 30 Sep 2026 | Tropical storm | 40 knots (75 km/h) |
| Isaias | 4 Oct 2026 to 11 Oct 2026 | Category 3 hurricane | 105 knots (195 km/h) |
About this data
- Where it comes from
- NOAA National Centers for Environmental Information: NOAA NCEI, IBTrACS v04r01, North Atlantic · source
- Licence
- Data from NOAA NCEI, IBTrACS v04r01 (Gahtan et al. 2024, doi:10.25921/82ty-9e16) (US government work, public domain; cite as asked)
- Retrieved
- 19 Oct 2026, 02:35 UTC; the owner last changed the file on 18 Oct 2026
- What Atlas did
- Listed every 2026 system that reached tropical storm strength, with its first and last record and its strongest point. Peak wind is the highest 1-minute sustained wind in the US record, in knots and km/h.
- Weak points
- Provisional data: storm strengths and dates for 2026 may change in NOAA's review.
Shown as is. Atlas counts from official public records and does not check or guarantee them.
Step 5: What is expected
What NOAA expected for 2026
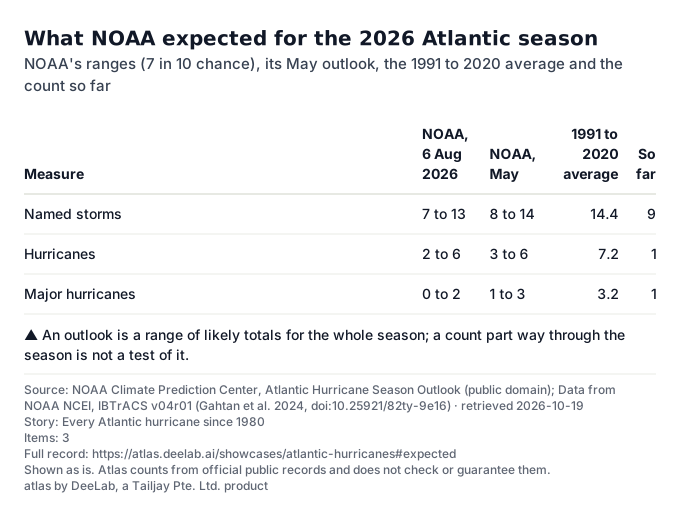
NOAA's updated outlook of 6 Aug 2026 gave a 75% chance of a below-normal season, 20% near normal and 5% above normal.
It expected 7 to 13 named storms, 2 to 6 hurricanes and 0 to 2 major hurricanes, each range with a 7 in 10 chance. To 11 Oct 2026 the season had 9, 1 and 1.
This is NOAA's outlook as published, not an Atlas forecast. NOAA does not forecast where storms will make landfall.

Show the table (3 rows)
| Measure | NOAA, 6 Aug 2026 | NOAA, May | 1991 to 2020 average | So far |
|---|---|---|---|---|
| Named storms | 7 to 13 | 8 to 14 | 14.4 | 9 |
| Hurricanes | 2 to 6 | 3 to 6 | 7.2 | 1 |
| Major hurricanes | 0 to 2 | 1 to 3 | 3.2 | 1 |
About this data
- Where it comes from
- Licence
- Source: NOAA Climate Prediction Center, Atlantic Hurricane Season Outlook (public domain) (US government work, public domain)
- Data from NOAA NCEI, IBTrACS v04r01 (Gahtan et al. 2024, doi:10.25921/82ty-9e16) (US government work, public domain; cite as asked)
- Retrieved
- 19 Oct 2026, 02:36 UTC
- 19 Oct 2026, 02:35 UTC; the owner last changed the file on 18 Oct 2026
- What Atlas did
- Copied NOAA's published ranges, chances and date from the Climate Prediction Center page; Atlas adds no forecast.
- Put the count so far next to them from IBTrACS.
- Weak points
- An outlook is a range of likely totals for the whole season; a count part way through the season is not a test of it.
Shown as is. Atlas counts from official public records and does not check or guarantee them.
Sources
- NOAA NCEI, IBTrACS v04r01, North Atlantic · US government work, public domain; cite as asked · retrieved 2026-10-19
- NOAA Climate Prediction Center, Atlantic Hurricane Season Outlook · US government work, public domain · retrieved 2026-10-19
- Borders and coastlines: Natural Earth, 1:110 million scale, version 5.1.2, downloaded on 2026-10-18. Made with Natural Earth (public domain). Projection: Equal Earth. Borders follow Natural Earth's default view and are not a statement by Atlas.
Data to 11 Oct 2026. Atlas made no forecasts on this page; outlooks and long-run rates are the owners' own, with their dates.
atlas by DeeLab, a Tailjay Pte. Ltd. product